This post is part three of Why Confidence Matters, a series about how we improved Defender’s confidence score to unlock a number of important features. You can read part one here and part two here.
Bringing our series to a close, we explore the technical design of our research pipeline that enabled our Data Scientists to iterate over models with speed. We aim to provide an insight into how we solved issues pertaining to our particular dataset, and conclude with how this project had an impact for our customers and product.
Why design a pipeline?
Many people think that a Data Scientist’s job is like a Kaggle competition – you throw some data at a model, get the highest scores, and boom, you’re done! In reality, building a product such as Tessian Defender was never going to be a one-off job. The challenges of making a useful machine learning (ML) model in production lies not only in its predictive powers, but also in its speed of iteration, reproducibility, and ease of future improvements.
At Tessian, our Data Scientists oversee the project end-to-end, from conception and design, all the way through to deployment in production, monitoring, and maintenance. Hence, our team started by outlining the above longer-term requirements, then sat down together with our Engineers to design a research flow that would fulfill these objectives.
Here’s how we achieved the requirements we set out.
The research pipeline
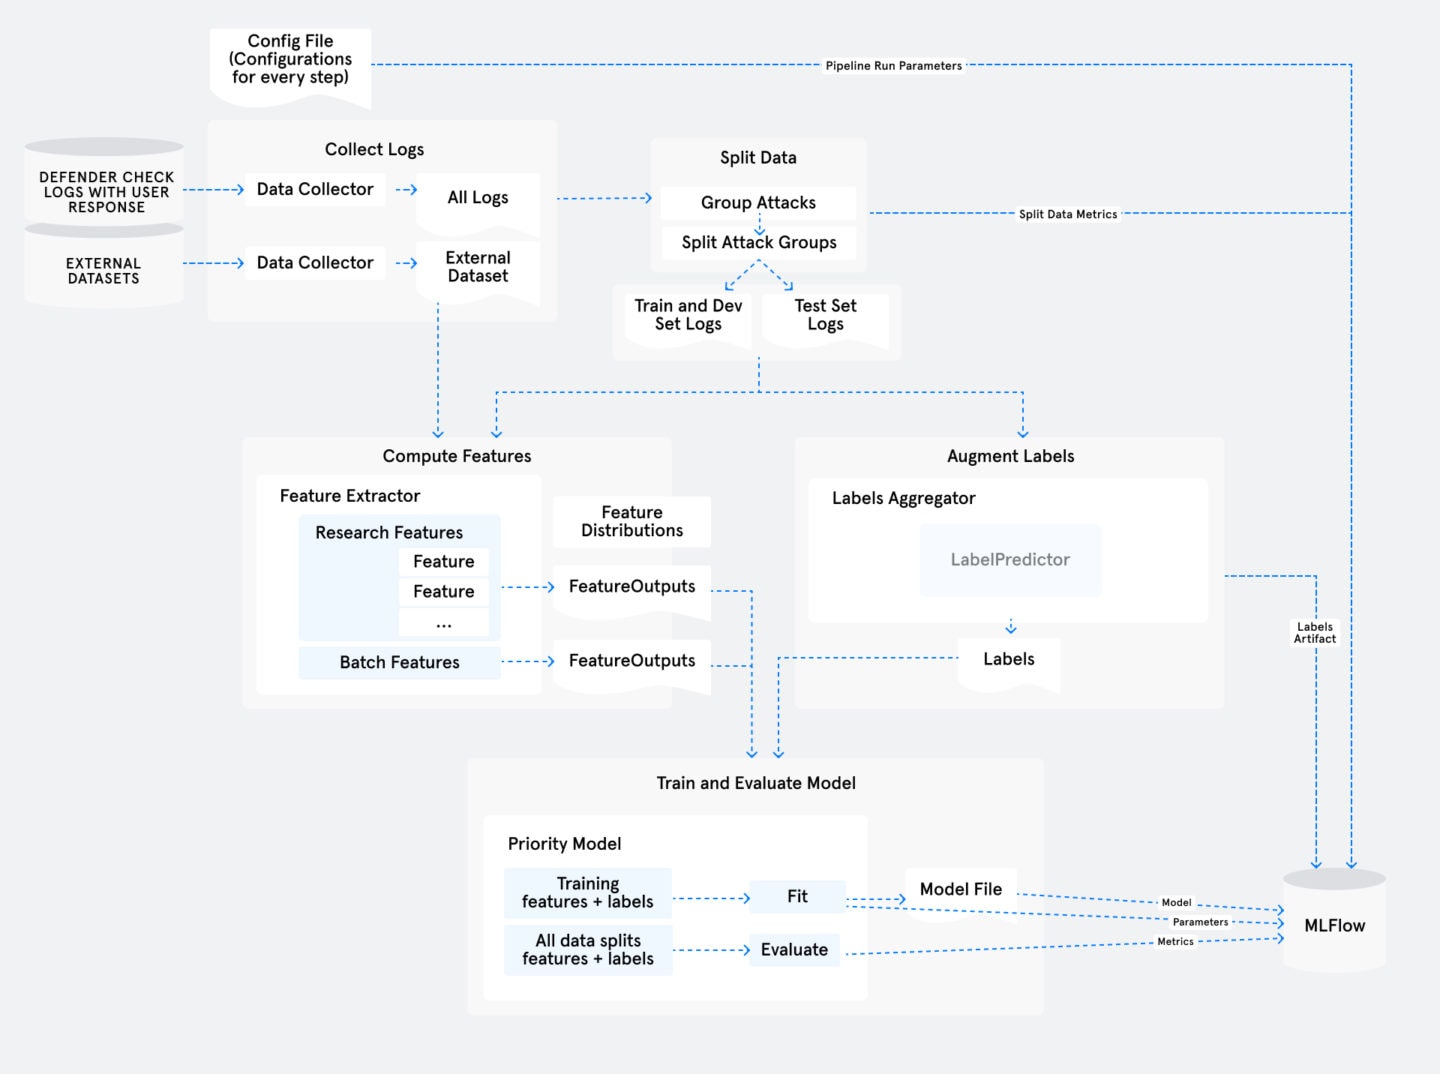
The diagram above shows the design of the pipeline with its individual steps, starting from the top left. An overall configuration file specifies many parameters for the pipeline, such as the date range for the email data we’ll be using and the features we’ll compute. The research pipeline is then run on Amazon Sagemaker, and takes care of everything from ingesting the checked email data from S3 (Collect Logs step) to training and evaluating the model (at the bottom of the diagram).
Because the pipeline is split into independent and configurable “steps”, each storing its output before the next picks it up, we were able to iterate quickly. This provided flexibility to configure and re-run from any step without having to re-run all the previous steps, which allowed for experimentation at speed.
In our experience, we had only to revise the slowest data collection and processing steps a couple of times to get it right (steps 1-3), and most work and improvements involved experimenting with the features and model training steps (steps 4-5). The later research steps take only a few minutes to run as opposed to hours for the earlier steps, and allow us to test features and obtain answers about them quickly.
Five Key Steps within the Pipeline
Some of these will be familiar to any Data Science practitioner. We’ll leave out general descriptions of these well-known ML steps, and instead focus on the specific adjustments we made to ensure the confidence model worked well for the product.
1. Collect Logs
This step collects all email logs with user responses from S3 and transforms them to a format suitable for later use, stored separately per customer. These logs contain information on decisions made by Tessian Defender, using data available at the time of the check. We also lookup and store additional information to enrich and add context to the dataset at this stage.
2. Split Data
The way we choose to create the training and test datasets is very important to the model outcome. As mentioned before, consistency in model performance across different cuts of the data is a major concern and success criterion.
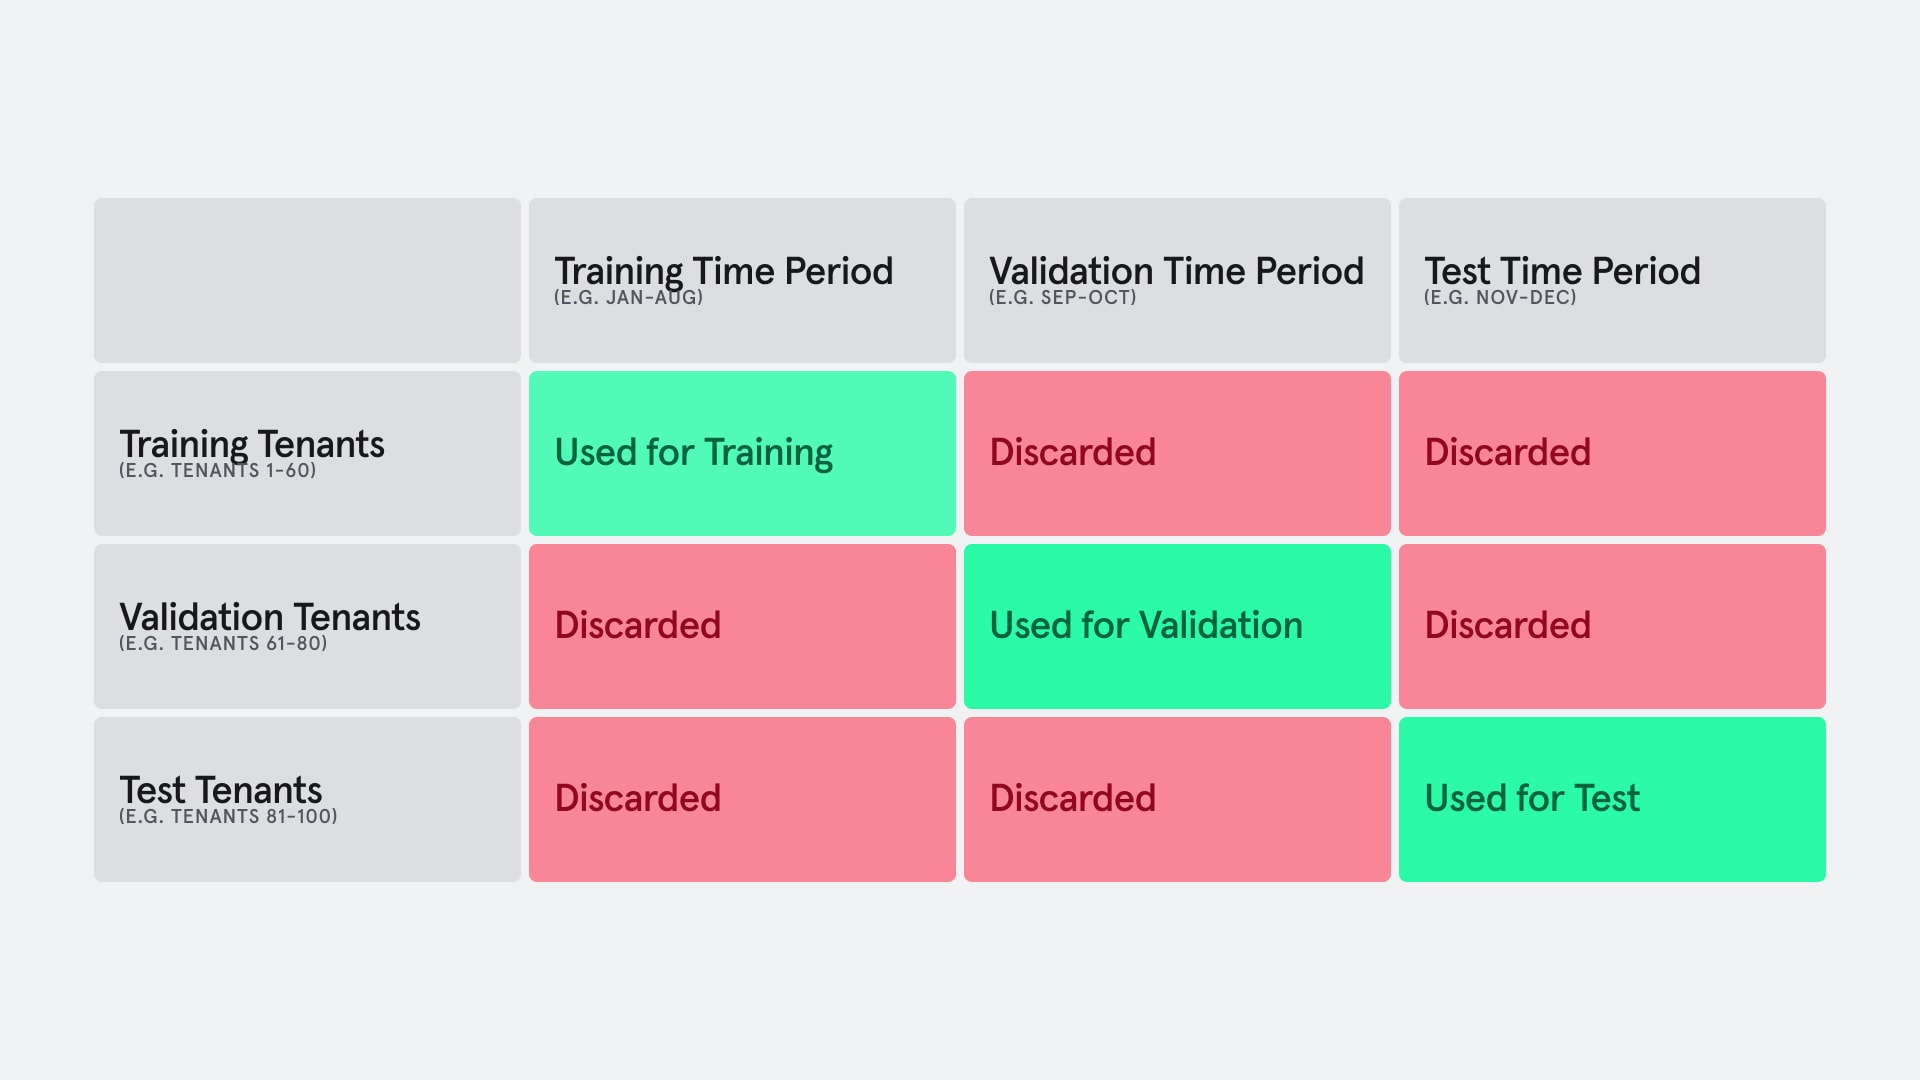
In designing our cross-validation strategy, we utilized both time-period hold-outs and a tenants hold-out. The time-period hold-out allows us to confirm that the model generalizes well across time even as the threat landscape changes, while testing on a tenant hold-out ensures the model generalises well across all our customers, that are spread across industries and geographical regions. Having this consistency means that we can confidently onboard new tenants and maintain a similar predictive power of Tessian Defender on their email traffic.
However, the downside to having multiple hold-outs is that we’re effectively throwing out data that did not fit within both constraints for each dataset, as demonstrated in the chart below.
Example of data discard due to hold-outs on multiple axes
We eventually compromised by allowing a slight overlap between train and validation tenants (but not on test tenants), minimizing the data discarded where possible.
3. Labels Aggregation
In part two, we also highlighted that one of the challenges of the user-response dataset is mislabelled data. Greymail and spam are often wrongly labeled as phishing, and can cause the undesired effect of the model prioritizing spam, making the confidence score less meaningful for admins. Users also often disagree on whether the same email is safe or malicious. This step takes care of these concerns by cleaning out spam and aggregating the labels.
In order to assess the quality of user-feedback, we first estimated the degree of agreement between user-labels and security expert labels using a sample of emails, and found that user-labels and expert-labels matched in around 85% of cases. We addressed the most systematic bias observed in this exercise by developing a few simple heuristics to correct cases where users reported spam emails as malicious.
Where we have different labels for copies of the same email sent to multiple users, we applied an aggregation formula to derive a final label for the group. This formula is configurable, and carefully assessed to provide the most accurate labels.
4. Features
This step is where most of the research took place – trialing new feature ideas and iterating on them based on feature analysis and metrics from the final step.
The feature computation actually consisted of two independently configurable steps: one for batch features and another for individually computed features. The features consisted of some natural language processing (NLP) vectorizations which were computed faster as a batch, and were more or less static after initial configurations. Splitting it out simplified the structure and maximized our flexibility.
Other features based on stateful values (dependent on the time of the check) such as domain reputations and information from external datasets were computed or extracted individually, such as whether any of the URL domains in the email was registered recently.
5. Model Training and Evaluation
In the final and arguably most exciting step of the pipeline, the model is created and evaluated.
Here, we configure the model type and its various hyperparameters before training the model. Then, based on the validation data, the “bucket” thresholds are defined. As mentioned in part two, we defined five confidence buckets that simplified communication and understanding with users and stakeholders. These buckets range in priority from Very Low to Very High. In addition, this step produces the key metrics we’ll use to compare the models. These metrics include both generic ML metrics and Tessian Defender product-specific metrics as mentioned in part two, against each of the data splits.
Using MLFLow, we can keep track of the results of our experiments neatly, logging the hyperparameters, metrics, and even store certain artifacts that would be relevant in case we needed to reproduce the model. The interface allowed us to easily compare models based on their metrics.
Our team held a review meeting weekly to discuss the things we’ve tried and the metrics it has produced before agreeing on next steps and experiments to try. We found this practice very effective as the Data Science team rallied together to meet a deadline each week, and product managers could easily keep track of the project’s progress. During this process, we also kept in close contact with several beta users to gather quick feedback on the work-in-progress models, ensuring that the product was being developed with their needs in mind.
The improved confidence score
The new priority model was only deployed when we hit the success criteria we set out to meet.
As set out in part two, besides the many metrics such as AUC-ROC we tracked internally in order to give us direction and compare the many models, our main goal was always to optimize the users’ experience. That meant that the success criteria depended on product-centric metrics: the precision and number of quarantined emails for a client, the rate at which we could improve overall warning precision, and consistency of performance across different slices of data (time, tenants, threat types).
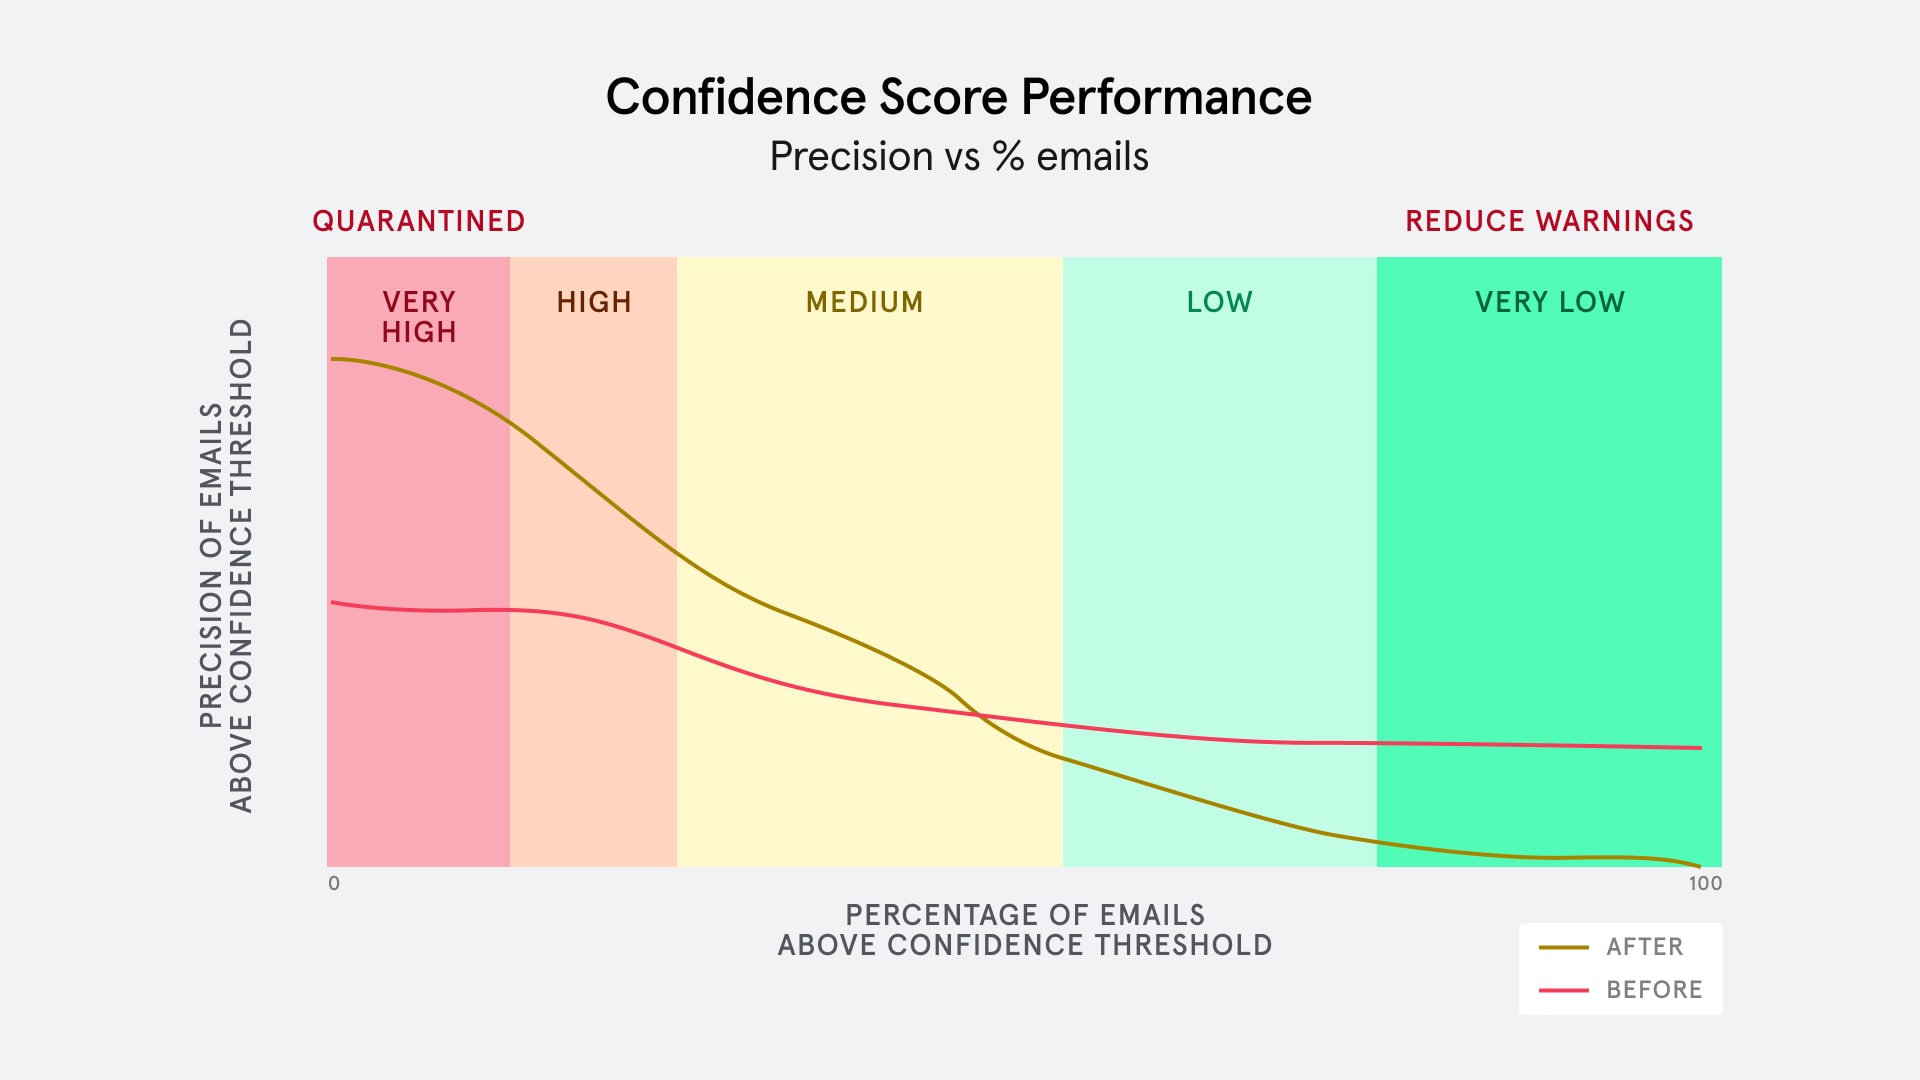
Based on the unseen test data, we observed a more-than-double improvement in the precision of our highest priority bucket, with our newest priority model. This improved the user experience of Tessian Defender greatly, as it meant that a security admin could now find malicious emails more easily and act on it more quickly, and that quarantining emails without compromising on users’ workflow was a possibility.
(Estimated) Graph of Precision against the highest confidence x% of emails
Product Impact
As a Data Scientist working on a live app like Tessian Defender, rolling out a new model is always the most exciting part of the process. We get to observe the product impact of the model instantly, and get feedback through the monitoring devices we have in place, or by speaking directly with Defender customers.
As a result of the improved precision in the highest priority bucket, we unlocked the ability to quarantine with confidence. We are assured that the model is able to quarantine a significant number of threats (for all clients), massively reducing risk exposure for the company, and saving employees precious time and the burden and responsibility of discerning malicious mails, at a low rate of false positives.
We also understand that not all false positives are equal – for example, accidentally quarantining a safe newsletter has almost zero impact compared to quarantining an urgent legal document that requires immediate attention. Therefore, prior to roll-out, our team also made inquiries to quantify this inconvenience factor, ensuring that the risk of quarantining a highly important, time-sensitive email was highly unlikely. All of this meant that the benefit of turning on auto-quarantine and protecting the user from a threat far outweighs the risk of interrupting the user’s work-flow and any vital business operations.
User Interface for a Quarantined Email
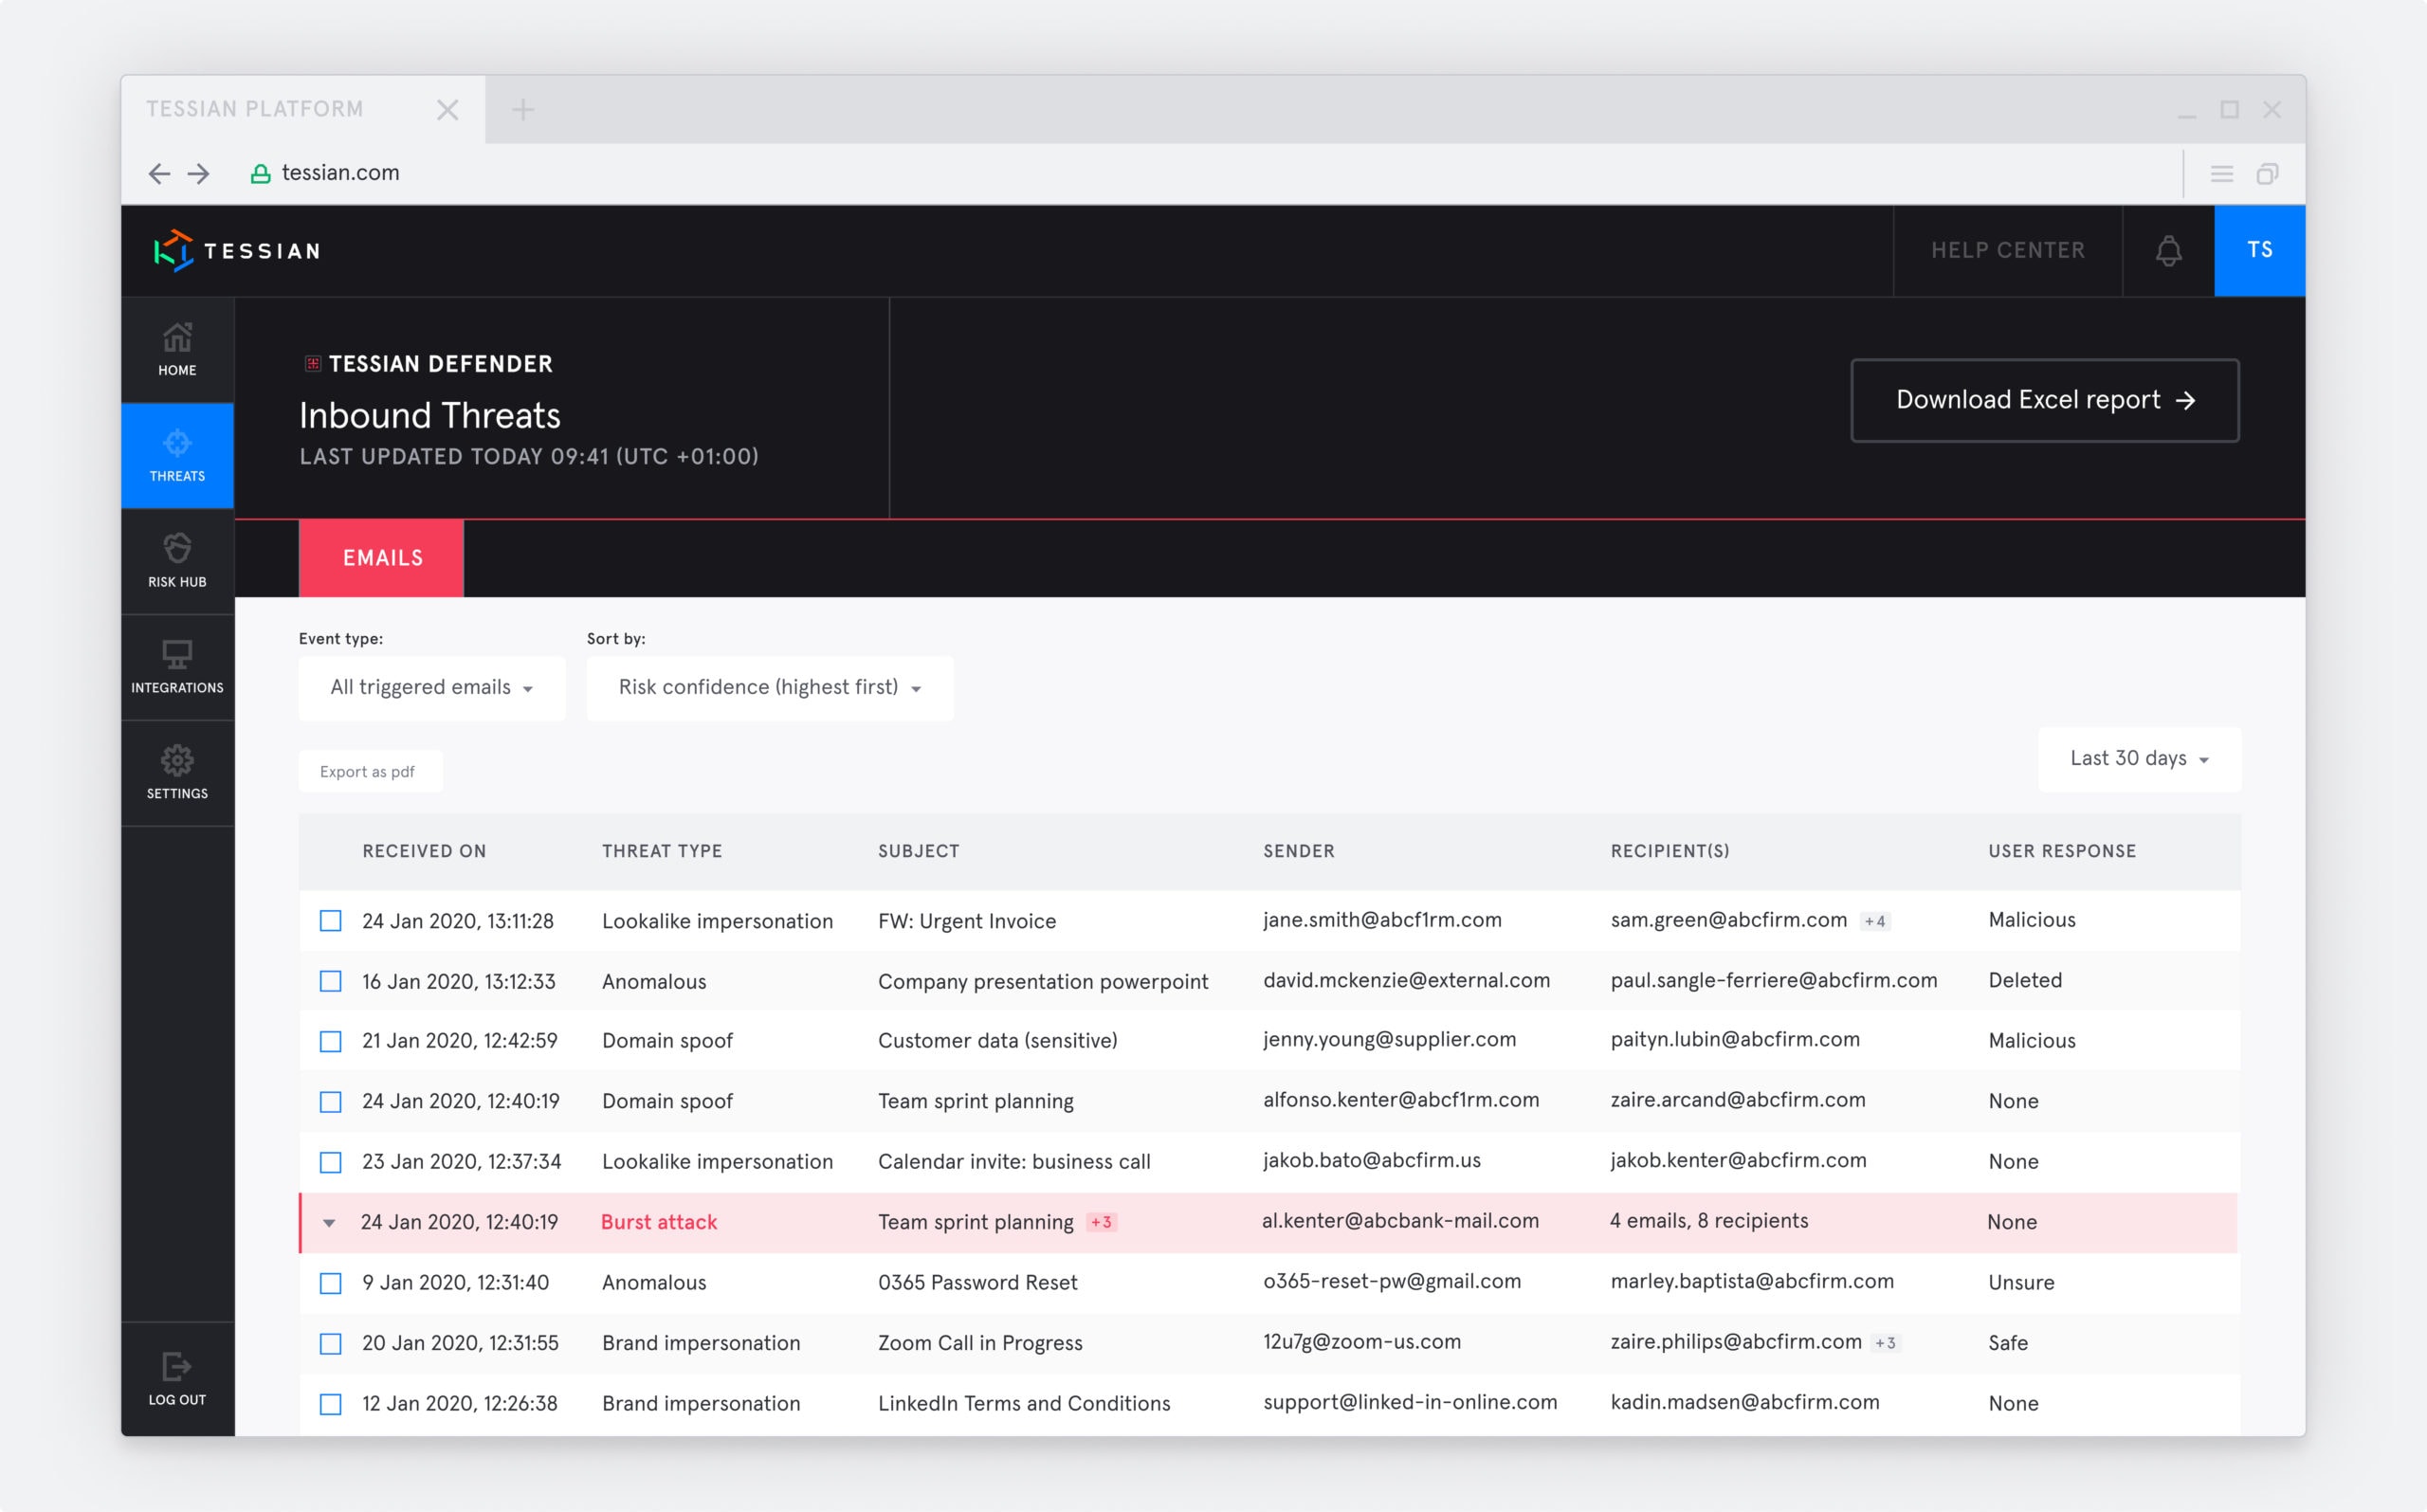
With this new model, Tessian Defender-triggered events are also being sorted more effectively.
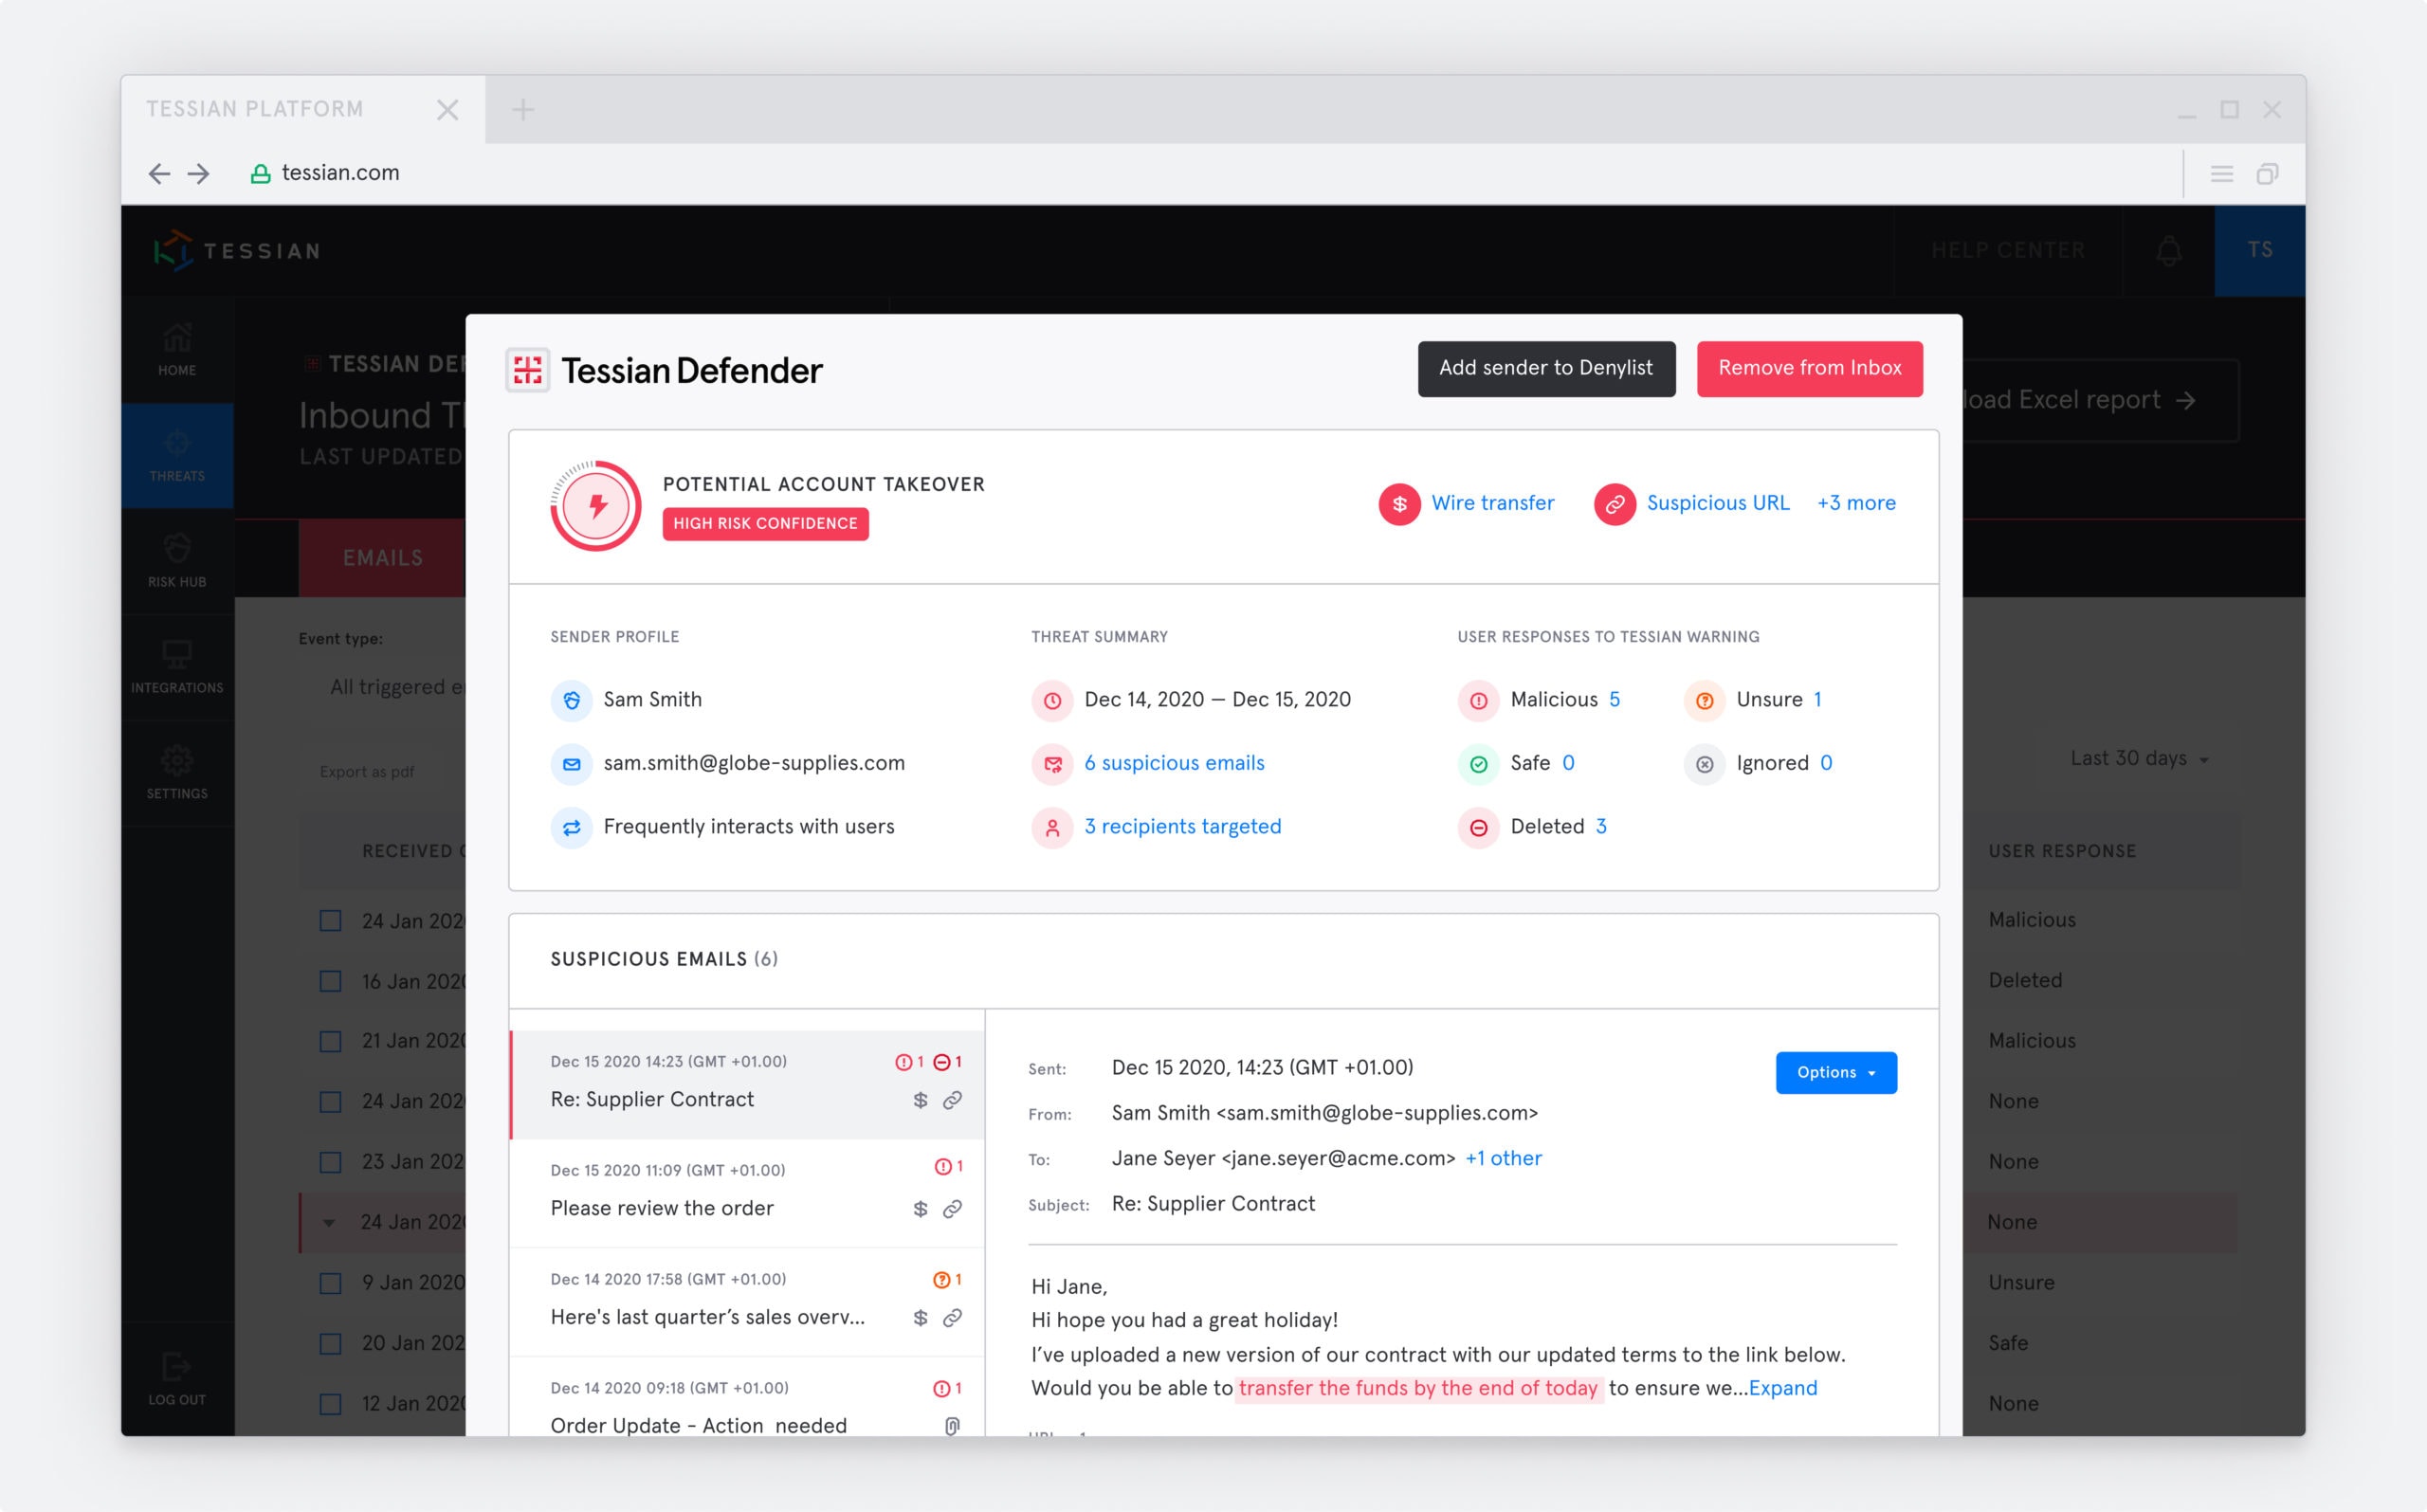
Admins who log in to the Tessian portal will find the most likely malicious threats at the top, allowing them to act upon the threats instantly. Admins can quickly review the suspicious elements highlighted by Tessian Defender and gain valuable insights about the email such as:
- its origin
- how often the sender has communicated with the organization’s users
- how users have responded to the warning
They can then take action such as removing the email from all users’ inboxes, or adding the sender to a denylist. Thus, even in a small team, security administrators are able to effectively respond to external threats, even in the face of a large number of malicious mails, all the while continuing to educate users in the moment on any phishy-looking emails.
Logging into the portal displays the most malicious emails at the top
Lastly, with the more robust confidence model, we are able to improve the accuracy of our warnings. By ensuring a high warning precision overall, users pay attention to every individual suspicious event, reap the full benefits of the in-situ training, and are more likely to pause and evaluate the trustworthiness of the email. As the improved confidence model is able to provide a more reliable estimate on the likelihood of an email being malicious, we are able to cut back on warning on less phishy emails that a user would learn little out of.
This concludes our 3-part series on Why Confidence Matters. Thank you for reading! We hope that this series has given you some insight into how we work here at Tessian, and the types of problems we try to solve.
To us, software and feature development is more than just endless coding and optimizing metrics in vain – we want to develop products that will actually solve peoples’ problems. If this work sounds interesting to you, we’d love for like-minded Data Scientists and Developers to join us on our mission to secure the Human Layer! Check out our open roles and apply today.
(Co-authored by Gabriel Goulet-Langlois and Cassie Quek)
Cassie Quek
Data Scientist II


